From abnormal weather conditions such as heat waves and huge typhoons to changes in the fish prices at supermarkets, global warming is becoming a compelling issue that also has a large impact on our lives. However, the earth seems to look somewhat different in the eye of an expert who calculates the “earth’s future” based on massive data and computations detached from such human subjectivity and actual feelings, as if to calculate the parabola of a thrown ball.
Special Feature 1 – The Abyss of Global Warming Future vision of the earth as defined by the Earth Simulator
text by Masakazu Yanai

Michio Kawamiya
Director, Research Center for Environmental Modeling and Application, Research Institute for Global Change, Japan Agency for Marine-Earth Science and Technology
Born in Nagoya, Aichi Prefecture in 1969. Graduated from the Department of Earth and Planetary Physics, The University of Tokyo. Completed the doctoral course at the Graduate School of Science, The University of Tokyo. Assumed the present post after serving as a researcher at the Center for Climate System Research, The University of Tokyo, a researcher at the Institute of Marine Sciences, Kiel University, Germany, and a Principal Researcher at the Japan Agency for Marine-Earth Science and Technology (JAMSTEC). Selected as a member of the Task Group on Data Support for Climate Change Assessments (TG-Data) of the Intergovernmental Panel on Climate Change (IPCC) since 2019.
“Don’t you ever feel depressed seeing the future of the warming earth?”
Dr. Michio Kawamiya from the Japan Agency for Marine-Earth Science and Technology (JAMSTEC) says he is often asked this question by other researchers. Many people hold a negative impression about the future earth. Dr. Kawamiya simulates such earth’s future. What does the earth within the computer-as we often see in science fiction films-look like?
JAMSTEC’s Yokohama Institute for Earth Sciences where Dr. Kawamiya works has the Earth Simulator-a supercomputer that calculates the earth’s future. In a giant building that could house a 50 m swimming pool, 80 cabinets taller than a human are arranged in rows (Figure 1).
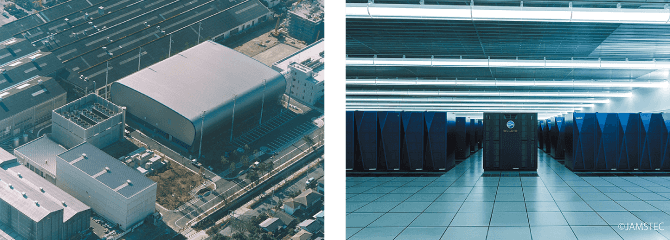
Figure 1. Earth SimulatorThe building housing the Earth Simulator has a floor area of 65 × 50 m, and a maximum height of about 17 m. Each of the 80 cabinets has 64 nodes, and each node is mounted with a 4-core CPU and a 64 GB memory. This CPU excels at parallel computing, which processes various data simultaneously. (Figures courtesy of JAMSTEC)
The Earth Simulator is quite different from ordinary computers. Home personal computers (PCs) are mounted with arithmetic units called central processing units (CPUs). The CPU executes instructed calculations in order. This process is like a ticket gate at a train station. It is as if people carrying instructions pass the ticket gate one by one.
The CPUs of PCs have a weak point-there is only one or few ticket gates at the station. Therefore, there will be a long waiting queue. Unlike a PC, the Earth Simulator has more than 20,000 cores, which are arithmetic units that correspond to ticket gates. Thus, it can process a large amount of calculations. Not only that, it also has an enormous memory. In contrast to the 4 GB memory recommended for Windows 10, the Earth Simulator is mounted with over 320,000 GB of memory.
How does the Earth Simulator with such capacity beyond imagination reproduce the earth’s climate change?
Dr. Kawamiya says: “The simulator performs calculations based on the laws of physics, using data of the atmosphere, oceans, sunlight, and other conditions. It is not making assumptions based on statistical data.”
Remember your junior high school textbook. If you throw a ball, it falls in a parabolic path. The movement of the ball can be obtained by a calculation. The same thing is conducted by the Earth Simulator.
How the air moves, how the ocean water flows, and how the sunlight affects the land surface-as a result of performing enormous calculations, the future state of the earth can be understood. It is as if you throw the earth ball straight up, and the future earth comes falling down into your hand.
How is the simulation performed?
“We create a small earth, segmenting the earth into small areas called grids. Then we enter the real earth’s values, and obtain the future state by calculation.
This series of work is conducted through international cooperation. Data collected from various countries and sorted out is used for the calculation. The standards for the data to be submitted at the end are also fixed. In this manner, the input data and output data are unified, but the internal processing and how the earth is modeled differ by research institute in each country.
For example, with regard to changes in the conditions of plants due to warming-changes in plants have a large impact on the global environment, but they cannot be expressed by physics formulas. The same applies to the amount of aerosol produced by human activity. We use research in the economics field as reference.
For such parts that cannot be expressed by physics, we prepare formulas approximated to actual conditions based on empirical knowledge. Physics calculations and simulated reproduction of organisms and society. The virtual earth is created by combining many research results.”
As the details of the earth differ by research institutes, the obtained results would differ even if the same data were used at the start. The future trend is identified by comparing these results.
“The simulation period is generally from 1850 to 2100 (Figure 2). Several scenarios are simulated, such as ‘the case where carbon dioxide (CO2) emissions are reduced’ and ‘the case where the present trend continues.’
Meanwhile, the grid spacing changes depending on the information to be obtained. For example, in order to look at how clouds are formed, the grid spacing needs to be reduced to 10 km (Figure 3). The realistic grid spacing for looking at the earth’s future is about 300 km. If we are to include the changes in the state of forests into the calculation, using any smaller grid spacing would require an immense amount of calculation.
After the simulation is completed, the data are organized in compliance with the standards, and submitted as an article. The submitted information is compiled into a voluminous report.
The initial creation of data to completion of the report takes a cycle of about six to seven years. It is a big project with the participation of researchers around the world. The last report was compiled in 2013. In the current cycle, the simulations were completed last year, and all articles for the report are scheduled to be submitted by 2021.”
By looking at the results, politicians across the world decide on their future policies. The simulation results serve as a compass pointing to the future.
What kind of future is forecast
Then, what kind of future can actually be forecast through the simulations? Let us look at the future vision which many researchers agree on.
“By 2030 to 2040, the global air temperature will rise by about 1.5°C from the level before the start of warming in the mid-19th century.”
The change may seem smaller than expected. We see news reports on heat waves of over 30°C every year. So we expect the temperature to rise by at least 3 to 4°C. What kinds of changes would occur to the earth if the temperature were to rise by 1.5°C?
“Extreme phenomena such as typhoons will increase. Typhoons cause damage to Japan every year, but their intensity will increase by about 10%.”
A 10% increase may seem small, but a natural disaster of an unexpected scale could bring grave damage.
“Also, the natural environment will be more extreme than at present. Dry land will become drier and will accelerate desertification or increase wildfires. Humid land will have more rain, leading to more frequent occurrence of floods and landslides.
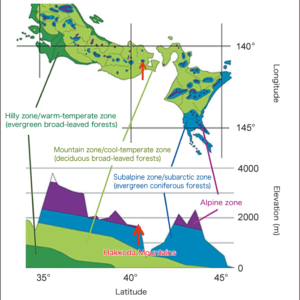
As the air temperature becomes higher, the plant distribution will also change. Plants themselves do not move for they have no legs. However, they are spread to the surroundings by winds and insects, and start growing in different places from the present. As a result, on the virtual earth with a grid spacing of 200-300 km, vegetation moves by 1-2 grids.”
Plant distribution can change by 400-600 km. Given that the distance from Tokyo to Osaka is about 400 km, we can see that the distributional change is quite significant.
“The ocean circulation will also be affected. The circulation of water will become slower than now at deep points. As a result, the strength of the ocean currents around the world will become weaker. This effect also extends to climate on land. It is because air temperatures in coastal areas are affected by warm currents or cold currents.
Areas that are high-latitude but warm, as in Europe, benefit from warm currents. If the currents change, the speed of warming may slow down in those areas in correspondence to their latitudes.”
Not only that. If the ocean does not circulate well, it could affect the growth of plankton and the like, and lead to a decrease in fish catches.
“The Arctic sea ice receives a particularly large impact. It is said that there will be no ice during the summer by the mid-21st century. If there is no white ice to reflect the sunlight, the sea will absorb heat more easily. As a result, the air temperature in the Arctic may rise by more than 10°C.
Some future changes are not predictions, but are definite. The ocean’s capacity to absorb CO2 will decrease. A large amount of CO2 is already dissolved in the ocean, and there is a limit to the amount that can be dissolved.
Also, as mentioned earlier, the water circulation will be weaker at deep points of the ocean. Unless the ocean water is mixed, the amount of CO2 that can dissolve in the water will decrease. This is because, once the surface water absorbs CO2, it will not be easy for the water to absorb any more CO2.”
If the amount taken in by the ocean decreases, the CO2 that will remain in the atmosphere will increase. As a consequence, the warming might progress at a faster pace than at present. In addition, the ocean water becomes acidic when a large amount of CO2 is dissolved in it. If the marine environment changes, it will also have the risk of affecting ecosystems.
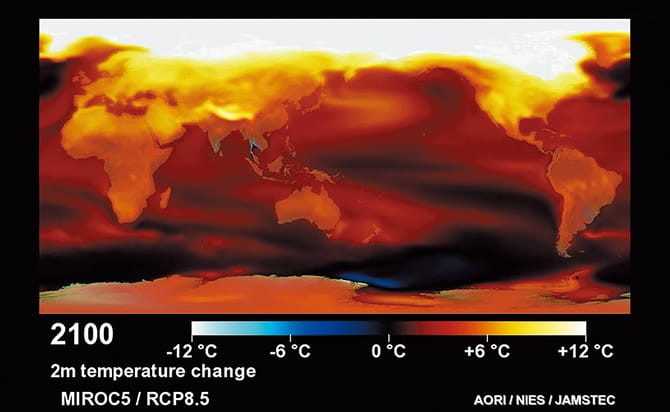
Figure 2. Change in the global average surface temperature at the end of the 21st centurySimulation results obtained from the climate model-Model for Interdisciplinary Research on Climate version 5 (MIROC5)-based on Representative Concentration Pathway 8.5 (RCP8.5), which is the highest warming scenario, assuming that no measures are taken to restrain warming.
Actuality of calculation using the Earth Simulator
Let us also touch upon the actuality of the calculation performed by the Earth Simulator-the magical technology that can depict the future. Calculation using a computer may give an impression that the user presses the execute button and waits several days to obtain the result. In reality, however, the user needs to do more than just press a button.
“There was a case where the simulated Siberian forest, taiga, grew larger and larger. The green parts become warm when they absorb light. Then, the forest grows, its color becomes darker, and it absorbs more light. This sequence was repeated and the simulated taiga grew into a thick forest.”
Perfect calculation formulas are not always created at the first attempt. Dr. Kawamiya says that researchers often gain impossible results after starting the simulation and recreate their model.
“The simulation process takes one month. During that while, we continue to monitor the data and have no time to rest, physically or mentally. Also, we cannot occupy the Earth Simulator all the time. As the simulator is used in many research projects, we stop and resume the simulation many times. So when the simulation is completed, we are all exhausted and gasp with joy.”
The tasks are troublesome not only for researchers that run the simulation, but also for those who create the data used for the calculation.
“While meteorological data are collected from around the world, some countries take meticulous records, and others do not. Unified data are created from those data.
Such activity is conducted by volunteer researchers. Although the cycle spans six to seven years, the researchers involved are actually constantly busy. The Paris Agreement adopted in 2015 included commitments by all countries to submit their updated targets for emissions reductions every five years. It is a difficult question how we should respond to such global demand.”
I also asked Dr. Kawamiya about future plans.
“The present Earth Simulator is the third generation. The simulator has been updated every six to seven years from the first generation in 2002, the second generation in 2009, and the third generation in 2015, with its performance becoming about 10 times faster each time.
Discussions are currently progressing on the design of the fourth generation. One of the challenges is how to incorporate elements of artificial intelligence.”

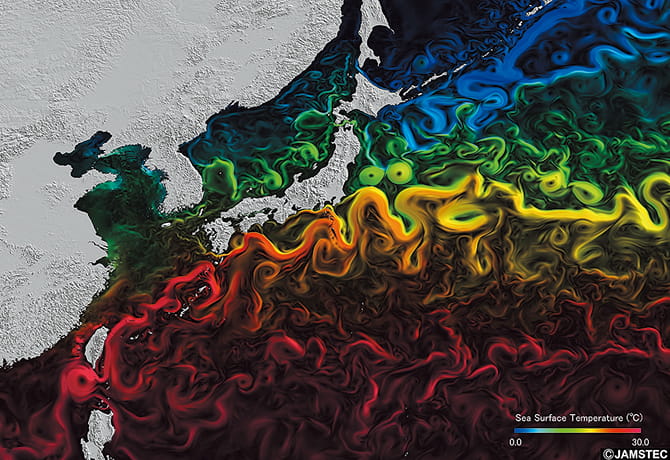 Figure 3. Parts of the simulated earth(Upper) Simulation of shallow cumulus developing over the ocean.
R. Onishi and K. Takahashi, A Warm-Bin-Cold-Bulk Hybrid Cloud Microphysical Model, Journal of the A mospheric Sciences, 69: 1474-1497, 2012.
(Lower) Sea surface temperatures and current strengths reproduced by high-resolution ocean model, Ocean General Circulation Model for the Earth Simulator (OFES.) (Figures courtesy of JAMSTEC)
Is the future bright or dark?
We will now get back to the first question. Is the future of the warming earth bright or dark?
“The public impression is shifting toward the extreme. I think this partly owes to overstatements by the media. For example, torrential rains are caused more by the effect of urbanization (heat island effect) rather than global warming.”
What Dr. Kawamiya actually feels is that the future will not be like a disaster film. However, warming will steadily progress, and have impacts on the atmosphere, oceans, and plant growth.
“There is not much meaning in looking at the air temperatures of each year and saying they were high or low. In the past, we used to say that definitive future conditions are unknown. But this is not good, so recently we have been explaining that the probability will increase or decrease.
Fundamentally, meteorological phenomena change every year. Even under such variable conditions, the probability of high temperature or arrival of huge typhoons may increase. The earth’s changes are like that in the first place.”
This means that changes will occur from a long-term perspective-such as having more years with heat waves or warm winters or more typhoon damage when looking by the unit of five years or ten years.
Here is one more question to satisfy a science fiction interest. Is it possible to create an earth detailed enough for people to live on, within a computer, as often seen in films or novels?
“As a result of an experiment using the K computer, which is said to have higher computing power than the Earth Simulator, when the grid spacing was set at about 800 m, only the data for one or two days could be calculated. This is because vast calculations are required.”
This suggests that there is still a long way to go before we can simulate an earth detailed enough for people to live on.
We cannot reproduce the earth as it is, but we can take a glimpse of what the earth might be like in a few decades’ time. By combining enormous computing power, physics formulas for calculating the movements of the atmosphere and the ocean, and knowledge gained through observation of plants and human activities, we are able to foresee future developments and work out countermeasures-this is how far human wisdom has progressed.